
Scribble Maps Blog
Know Before You Go: Situation & Market Intel Comes to Scribble Maps
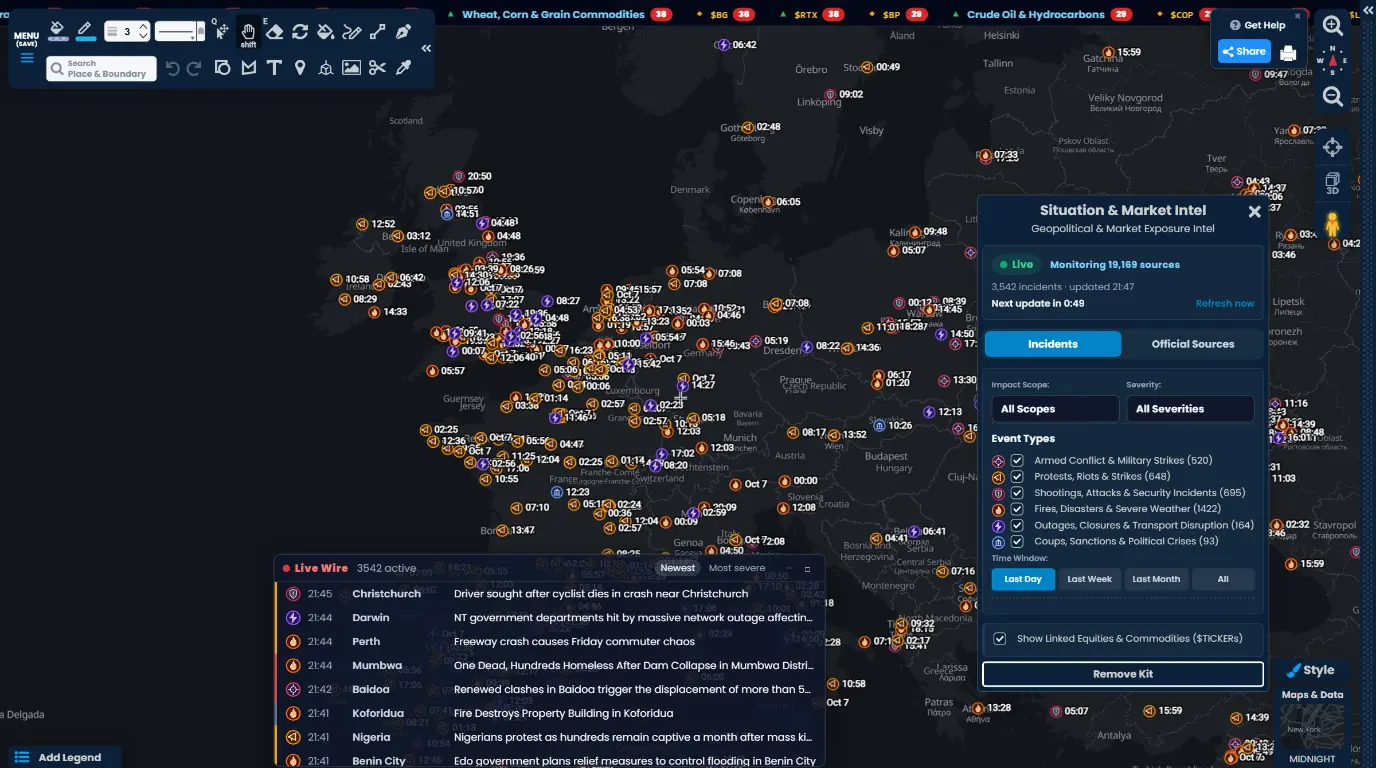
Your team lands in a city tomorrow. Tonight, a march is forming two blocks from the hotel. A fire has closed the road to the airport. A strike is called for the morning. Knowing this before you go can change the route, the hotel, or the whole trip. But this kind of awareness has mostly lived in costly intelligence subscriptions built for large security departments.
Today that changes. The new Situation & Market Intel kit reads more than 19,000 public news sources and puts live incidents from around the world on your map: protests and riots, shootings and attacks, fires and disasters, outages and closures, armed conflict, and political crises. Each one shows where it happened, how severe it is, and which stocks and commodities it may affect.
Powerful data for everyone
Our mission at Scribble Maps is to make mapping accessible, and to give everyday businesses and individuals the same powerful data that used to be reserved for organizations with big budgets and dedicated analysts. A small security firm protecting one traveller deserves the same live picture as a global risk desk. A family business with staff abroad deserves to know what is happening where its people are.
That is why Situation & Market Intel is not a separate subscription or an add-on fee. Real-time incidents are included in Pro Business, alongside every other Scribble Maps kit, for $90 a month billed yearly, or $100 a month month to month. And you can try it risk free for 7 days.
On any plan, you can use the kit with every incident worldwide, 36 hours behind. It is a free way to see what the kit does before you upgrade.
What you get
- Live incidents on the map. Every incident is a marker, grouped by type, with the time it happened beside it. The map updates on its own about once a minute.
- Filters that cut the noise. Show only what matters: local, state, national or global impact, critical incidents only, the event types you care about, and the last day, week or month.
- The Live Wire. A running list of the latest incidents along the bottom of the map. Sort by newest or most severe, and click a row to fly straight to it.
- One brief from every report. Click More info on an incident for a single brief built from all the news reports about it: a summary, the key facts, a timeline, the impact on safety and movement, and any claims that conflict. The sources are listed at the end.
- Official sources. Pick a country to read the United States, United Kingdom and Canada travel advisories, each with a level from 1 to 4. See official alerts for earthquakes, disasters and severe weather, and put the last 7 days of them on your map.
- Good news too. Switch Show to Positive to map openings, reopened roads and restored services, resource and scientific discoveries, and ceasefires, agreements and large investments. A new clinic or a reopened road counts, so it helps with site selection as well as travel.
- Market exposure. A ticker across the top lists the stocks and commodities current events may affect, each marked as a likely tailwind, headwind or mixed effect. Hover to see the incidents behind it.
- Incidents you can keep. Click Save to map to keep an incident as a regular marker. Share it, style it, and export it with the rest of your map.
- Ask Scribble AI. Ask "Is anything happening near Lagos?" or "Any riots in Paris this week?" and get an answer from the same live incidents.
- Connect your own AI tools. With Feed MCP, send the live feed to Claude, ChatGPT, Cursor, Copilot or your own tools. No API key needed: just sign in and click Allow.
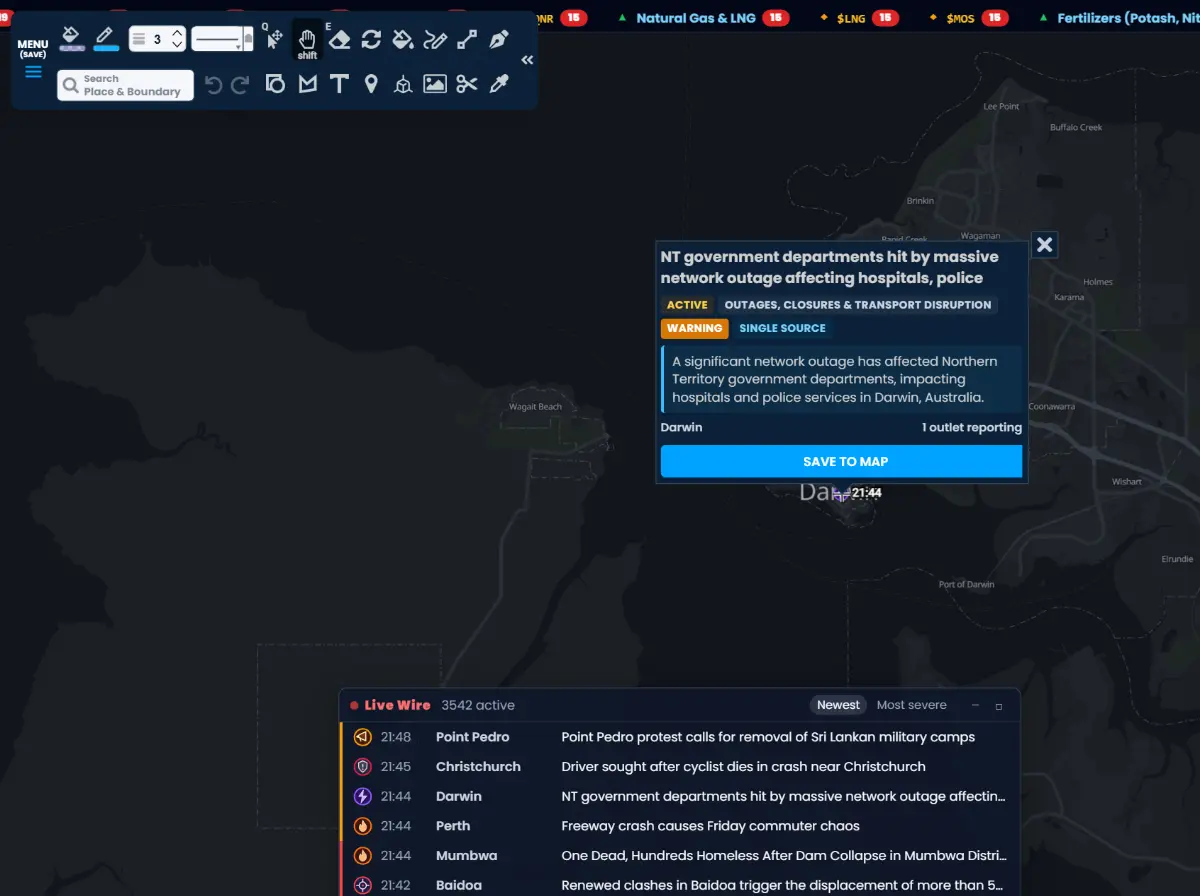
We are honest about what it is. Incidents are collected automatically from public news sources, so some can be missed, reported late or placed in the wrong spot. Use it to stay aware, alongside your other sources, not as the only one.
Who it is for
- Executive and travel security: check a city before your principal arrives, and watch for riots, protests, fires and closures near the hotel, the venue and the route.
- Corporate travel and HR: see what is happening where your people are, and read the official travel advisories in one place.
- Operations and supply chain: spot strikes, port and airport disruptions, outages and disasters that could hold up shipments.
- Analysts and investors: see which markets current events may move, and trace each one back to the incidents behind it.
- Journalists and researchers: follow a developing story across a region on one live map.
Try it
Open the Launch Pad or Maps & Data, find Situation & Market Intel, and click Real-time. Read the notice, then click I Understand & Accept.
Not on Pro Business yet? Click Delayed on the kit card to explore every incident worldwide, 36 hours behind, for free, or start your 7-day trial.
For a full walkthrough, read Situation & Market Intel - Live Incidents, Official Alerts and Market Exposure in the help center.