
Scribble Maps Blog
How to Teach Wildfire Spread with a Controlled Map Experiment
Give a class a wildfire map and the first question may be, “Where will the fire go?” A more useful lesson starts with, “What changes when we change one assumption?”
Keep the area, ignition point and comparison time fixed. Change the wind direction, return to the baseline, then change fuel dryness. Students can compare the mapped patterns, explain their reasoning and identify what the model leaves out.
This guide is for educators building a geography or environmental science lesson. The exercise below is illustrative, not a record of a customer lesson or a completed simulation. It supplies a plan and an observation sheet. Students supply the observations.
Start with a question the comparison can answer
Try this: How does a change in wind direction alter the simulated spread across the same landscape? That keeps the task focused. “Which neighbourhood is safe?” asks something this exercise cannot establish.
Natural Resources Canada describes its Fire Behaviour Prediction system as relating fire characteristics to wind, fuel moisture and topography. Those inputs give students a reason to look beyond the outline of a fire and examine the assumptions behind it.
Scribble Maps’ Fire kit supports comparisons in the United States and Canada. It is a planning simulation, not a forecast of an actual fire. Never use it to decide whether to evacuate. For an active incident, follow local emergency services.
Agree on what will stay the same
Choose one study area and a single ignition marker. Keep both unchanged throughout the exercise, along with the simulated hour used for comparison. Ask students to note the terrain and fuel-data confidence before predicting a result. Do not choose a location to imply a threat to a particular home or school.
Use a simple baseline, then make two separate comparisons:
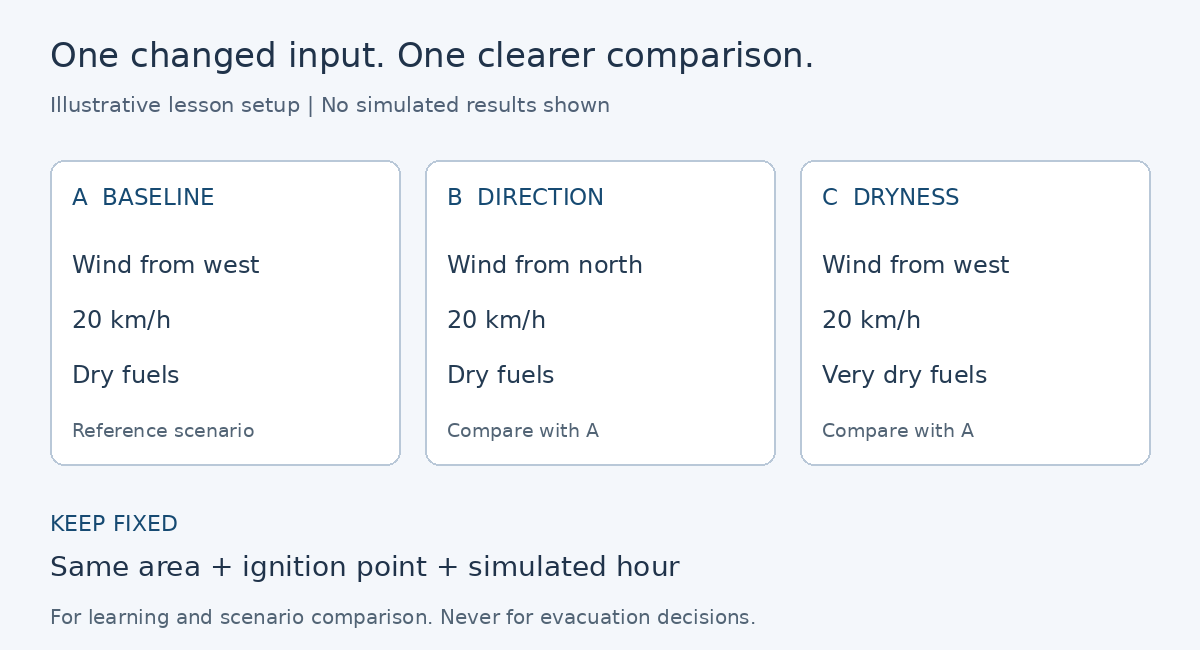
Illustrative settings only. The diagram shows the experimental setup, not modelled fire perimeters or measured outcomes.
In the controls, Wind from means the direction the wind comes from. Make that explicit before students interpret a north or west wind.
Prepare the area once, then vary the scenario controls. Fire is included in Pro Business, and signed-in accounts receive three free fire analyses. Preparing an area uses one; changing the wind, dryness, ignition or time does not use another. The maximum study area is 50,000 acres, about 200 square kilometres.
The complete setup instructions are in Fire - Wildfire Spread Simulation. Use those instructions for the controls while keeping the lesson centred on comparison.
Predict, observe, then explain the difference
Before displaying scenario B, ask students to sketch or describe their prediction. Then compare B with A at the same simulated hour. Repeat with C, restoring A’s wind settings first. Comparing C directly with B changes two inputs and makes the explanation harder to separate.
Use this observation sheet for each comparison:
| Record | Question for the learner |
|---|---|
| Prediction | What do you expect to change, and why? |
| Changed input | Which single setting differs from A? |
| Mapped observation | Where does the simulated perimeter differ at the same hour? |
| Reported observation | How does the displayed burned area compare? |
| Explanation | What pattern supports your explanation? What else might matter? |
| Limit | What does this comparison leave unresolved? |
Do not give the class an invented “correct” burned area or promise that every landscape produces the same pattern. Read the actual output together. A small difference, an unexpected shape or an inconclusive result is something to investigate rather than hide.
Record each scenario’s settings and observations before moving on. When you save the map, its Fire layer and report card preserve the simulation as it stands at that moment. Keep the written comparison too, so changing the controls does not leave you relying on memory. A result without its assumptions is difficult for another group to interpret.
Make the model’s missing pieces part of the lesson
Ask students to find one place where the simulation might look more reassuring than it should. The Fire kit does not model ember spotting, changing weather or firefighting. A road or water body that stops its simulated perimeter is not proof that a real fire could not cross it.
For Canadian scenarios, interpret the displayed times as active afternoon burning hours, not elapsed clock time. Keep that distinction beside the observation sheet so “hour six” does not quietly become an arrival-time prediction.
The public explanation, How accurate is the Fire kit?, describes these limits and the input data behind the results. Have students use it to add a limitation to their explanation.
An exit response can be three sentences: “We changed ___. The simulation showed ___. This does not establish ___.” That checks whether students can connect an input to an observation while keeping the conclusion within the evidence.
Finish with a comparison someone else can check
The useful outcome is a small set of labelled scenarios, predictions, observations and limits. Another group should be able to tell what changed, what stayed fixed and why the conclusion follows.
Build your lesson map. Begin with one area and one question, then let the comparison earn the explanation.